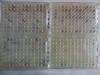


The EcoPlate is specifically designed for community analysis and microbial ecological studies.
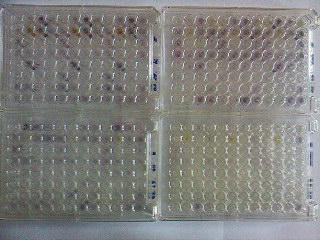
The EcoPlate contains three replicate wells of 31 of the most useful carbon sources for soil community-level physiological profiling (CLPP) of heterotrophic bacterial assemblages capable of being metabolically active and growing in plate conditions. While utilizing carbon substrates (31×3, depending on the plate type), microbes reduce a colourless dye to violet formazan. The colour is measured spectrophotometrically. This is a rapid and quite convenient method but it has many drawbacks - for example, only microbes that are cultivable and able to grow in high-nutrient conditions contribute to substrate utilization. CLPP yields a very large amount of data that may be difficult to interpret. (Feigl et al, 2017)
Biolog-derived data for evaluation generally include: the average well colour development (AWCD) and the Shannon diversity index (H).
AWCD is an indicator of the general potential metabolic activity of the microbial community, thus it is an index of the total bioactivity for the Biolog plates. AWCD values can be subdivided into SAWCD (substrate average well colour development) groups based on substrate guilds (carbon sources) of similar chemical nature, (e.g. amino acids, amines, carbohydrates, carboxylic acids, phenolyc compounds and polymers) to assess the potential of the soil microbial community to degrade these carbon sources. (Feigl et al, 2017)
The Shannon diversity index (H) is used to calculate the physiological diversity of bacterial communities. Microbial communities that are able to degrade more substrates or/and to degrade them with similar efficiency would have higher values of H compared to that part of the community which is not metabolically active and is not capable of growing in plate conditions. (Feigl et al, 2017)
Test procedure
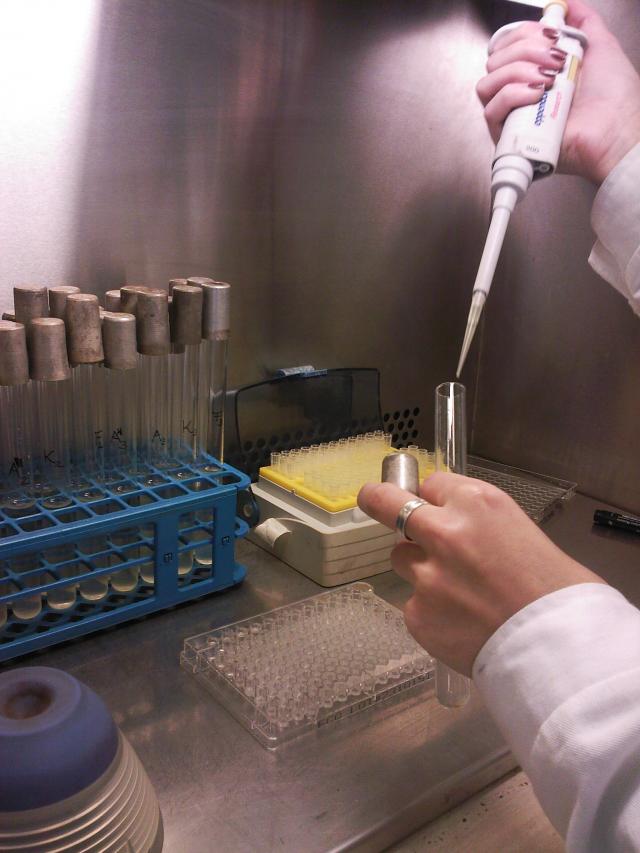
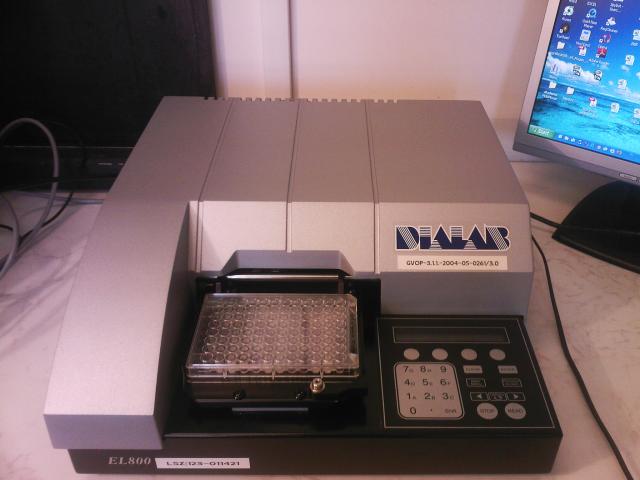
10 g soil in 90 ml sterile 0,85% NaCl solution is shaken for 30 minutes in a 250 mL flask. After 10 minutes settling, 1 mL diluted suspension is pippetted into 9 ml sterile 0,85% NaCl solution. The Biolog plate allows 3 replicate measurements. 125 μl diluted suspension is weighed into each well and the plates are incubated at 25 °C- packed in aluminium foil. The colour change is read with a Microplate Reader at 24, 48, 72, 96, 120, 144 and 168 hours.
Evaluation
During evaluation the a curve is plotted based on the optical density values measured versus time and for each substrate the area below the curve is measured and the average well colour development (AWCD) of each well.
AWCD = ODi /31
where ODi is optical density value from each well, corrected by subtracting the blank well
(inoculated, but without a carbon source) values from each plate well.
Nagy Zsuzsanna. Biolog Ecoplate test (in Hungarian) https://enfo.hu/keptar/750
Feigl, V., Ujaczki É., Vaszita, E., Molnár M. (2017) Influence of red mud on soil microbial communities: application and comprehensive evaluation of the Biolog EcoPlate approach as a tool in soil microbiological studies, Science of the Total Environment, 595, 903–911. http://dx.doi.org/10.1016/j.scitotenv.2017.03.266